
Real-time data has become a ubiquitous part of video display. The use of tickers displaying news headlines, weather, financial data and sports scores is common across the industry. As digital signage has grown in popularity, additional niche data feeds have been added. For example, flight arrivals and departures, local news and sports headlines, internal messaging, hyper-local ads and similar content. As digital signage made its way into new sectors such as corporate communications or specialized use cases such as manufacturing processes, the demand to read and visualize more real-time feeds has dramatically increased.
Interest in real-time data has exploded. Not only is it used to keep stakeholders up to date on multiple devices, it is an integral part of the Internet of Things, communicating with different devices, signaling when thresholds are met or exceeded and triggering automated processes.
It is not uncommon for a signage network to be required to ingest and read dozens of real-time feeds. Some are typical such as news headlines, but others are unusually complex. Content providers are forced to create a huge library of readers to service their customers and often must write custom code to integrate feeds.
The problem lies in the lack of consistency among data feeds. If a user wants to manage, moderate, edit or query incoming data content from the various feeds, it is near impossible without devoting a huge investment in custom development. Signage clients however are embracing “big data” and need tools to parse and reveal the data content and data trends that are most significant to their business and communications objectives.
Another approach is to reduce the need for custom code development by bringing all incoming data feeds into a centralized database and then using a set of standardized tools to manage the data. These tools would include moderation of social media, data content editing capabilities, scheduling, the creation of playlists from any data source, tools to query and an API to reformat and redistribute data to any destination. Similarly, aggregation tools can be optimized to handle more unusual data feeds that cannot be easily standardized.

This workflow has already been established in the broadcast industry especially in news, elections, sports and financial production. Producers working with real-time data require the ability to quickly and easily pull out and display the data content that is editorially significant. For example, a financial news producer wants to illustrate a down-turn in the manufacturing sector by displaying companies who have lost more than five percent of their stock value over the last six months. The producer uses querying tools to reveal and display the most significant data. These are common scenarios in broadcasting and the tools to facilitate them are well established.
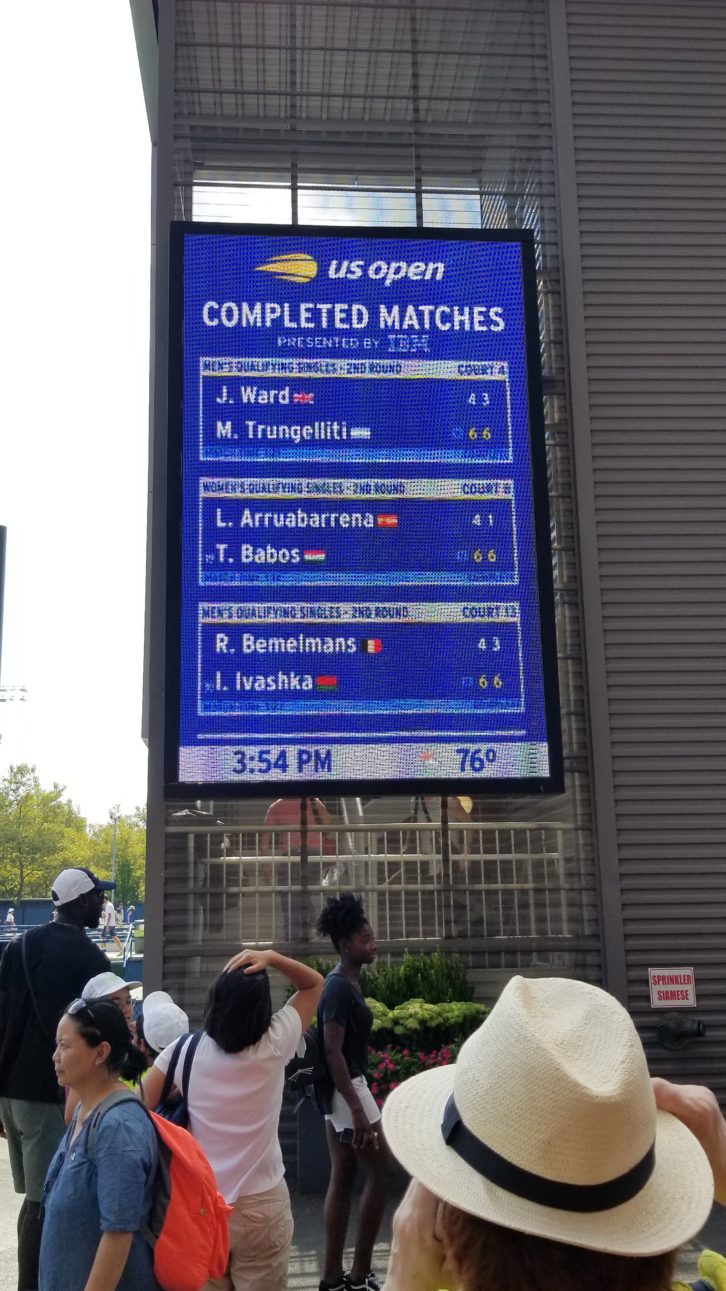
The need for this type of complex management of real-time data has started to become more relevant in digital signage. For the last two years the US Open Tennis Championship in Flushing Meadows, NY has displayed a wide variety of live data content across multiple displays throughout its facility, with each display having a specific editorial purpose. Outside of practice courts, producers display upcoming schedules, player biographies, schedules and brackets, while the screens located outside the main stadiums display subsets of the live action data; scoring, serve speeds, number of aces and unforced errors, news and other game specific data. Producers have come to understand that the signage displays are most engaging and effective when the live data content is relevant and targeted. To accomplish this, they employ the same tools broadcasters use to aggregate and manage data.
 No matter the signage use case, from retail to event displays to corporate communications, real-time data engages viewers, sells merchandise and promotes collaboration and a sense of belonging. Real-time data refreshes automatically, streamlines workflows and opens new ways to monetize content. Digital signage operators need to embrace the complexities of live data and utilize management and aggregation tools that grow ROI, strengthen workflows and foster new signage products and experiences.