Any sound engineer can tell you the exact size of every loudspeaker in their system. The answers are much less precise when it comes to the size of the sound waves coming out of the speakers. It is much easier for sound waves to wrap themselves around our heads than it is to wrap our heads around sound waves.
Their humongous variation in size, their invisibility, and solitary audibility (we can only experience sound exactly where we are) combine to create a tremendous challenge for our brains. But size matters, especially in sound. Size affects how sound transmits through the air, reflects off objects, is absorbed by surfaces, and wraps around balcony fronts for starters. It affects decisions on speaker placement, spacing and when to make a fuss about the beautiful set piece blocking the high horn. Nobody can see sound waves with their eyes, but as professional sound engineers we must have the ability to visualize them, a form of extra sensory perception that comes from understanding the nature of acoustic transmission. Our clients are counting on our ability to see sound. Otherwise it is the blind leading the blind.
SIZE AND SCALE
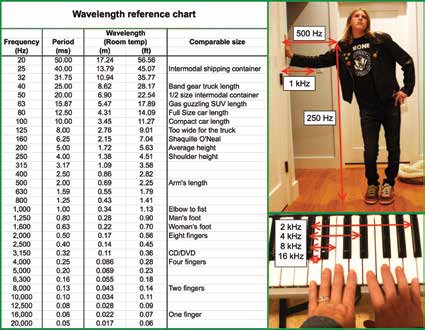
An audio frequency has physical size once it exists within a transmission medium. The wavelength (l) is the transmission speed/frequency or transmission speed x period (T). Wavelength is inversely proportional to frequency (becomes smaller as frequency rises). The first thing we all learned in audio was that our hearing ranges from 20Hz to 20kHz. Audible wavelengths in air range from around 56ft. down to about half an inch; the size of the largest intermodal-shipping container to the width of a child’s finger, a 1000:1 range. The mid-point audio reference of 1kHz approximately matches your elbow to your fist (Fig. 1).
Why should we care about wavelength? After all, no acoustical analyzers show this, and no knobs on our console can adjust it. In practice, we can be blissfully ignorant of wavelength, as long as we use only a single loudspeaker in a reflection-free environment. Good luck getting that gig. Wavelength is a decisive parameter in the acoustic summation of speaker arrays and rooms. Once we can visualize wavelength, we can see the spacing between speakers and surfaces, and visualize what will happen with the sound.
Let’s first address a fairly common misconception that large wavelengths (low frequencies) propagate more slowly than highs. Low frequencies are by definition a slower rate of change than highs, but the transmission speed through the medium (whether air, a wire or a magnet) is frequency independent.

Figure 2: Humidity air loss over distance
The transmission loss rate over distance, however, has a size-related aspect. High frequencies show a greater loss rate than lows in all cases and the effects vary with humidity (dry air is generally lossier than wet air) and slightly with temperature. The precise mechanism is complex but suffice to say that the loss rate rises as the transmitted wavelength gets closer to the molecular spacing of the medium. Air is low density so the losses are substantial at the high end of our hearing range. This means that all sound paths, both direct and reflected are increasingly filtered at the high end over distance. The steady darkening of reverberant decay is in large part due to the accumulated HF air loss over distance (Fig. 2).
It is well known that the speed of sound is temperature dependent. So is the size of sound, since it is proportional to transmission speed. The wavelength of sound is rescaling with temperature. It’s hard to visualize, since wavelengths of sound are … invisible. Instead we can do a reality polarity reversal and visualize temperature as rescaling our drawings of the sound system and the room, with wavelengths staying the same. In that parallel universe the room shrinks as it warms up. Either way, the reality is that a hot room fits fewer wavelengths of a given frequency than a cool one.
How much does the sound speed (and size) change over temperature? Not much. If we did a concert that went from a sauna to ice cold, the sound speed would fall by 10 percent. Not enough to fix a bad sound design or break a good one. At worst, we may need to adjust some delay settings.
REFLECTION, DIFFUSION AND DIFFRACTION
Sound propagation paths are typically modeled by the ray-tracing method. Sound propagates from the source in straight lines, like rays of sunlight. In free field, the sound continues outward and steadily loses level. The relative level values for each ray are adjusted to mimic the coverage pattern shape of the particular speaker.
When the ray strikes a surface it is reflected like light on a mirror (angle of incidence equals angle of reflection). Rays and reflections from additional speakers intersect and pass through those of the original source. This is the approximation of sound transmission and summation properties used in most modeling programs.
Now let’s look at the effects of size. The ray-tracing model holds up well for smooth surfaces large enough for the longest wavelengths to reflect like a mirror. The flat expanse of an arena floor is an equal opportunity reflection generator and can be modeled by ray tracing over the full audio range. By contrast, complex irregular surfaces scatter the sound in different directions over frequency, a process known as diffusion, a uniform field of non-uniformity. Surfaces with raised and lowered areas of various sizes and angles present a variable face to the variably sized sound waves. Therefore the uniform field of the sound wave that hits a diffuse surface reacts differently over frequency, scattering a less uniform copy of itself into the room.
In some cases, sound waves will bend around the surface, rather than bouncing off, a process termed diffraction. Tall walls line the sides of the freeway but somehow we still manage to hear the cars: diffraction bends it over the wall. Thanks to the miracle of diffraction, I hear firetrucks as if they are right outside my open ninth floor window! Diffraction over walls and through openings creates a secondary virtual transmission source. I have to stick my head outside the window (the other side of the diffractor) to localize the firetruck on the ground.
Small barriers (relative to l) are passed by with minimal effect. Large barriers (relative to l) reflect a substantial portion and leave a shadow area of low-level sound behind the barrier. Any actual barrier has frequency dependent diffractive properties due to fixed opening size and variable l. Small pillars block only high frequencies while others bend around. A 50ft. diameter pillar will block nearly everything.
Diffraction creates huge problems for audio installations. Diffraction is what makes people think it’s OK to put an I-beam in front of our speaker. They can still hear it, so what’s the problem? It’s thanks to diffraction that management thinks we should mix the show through a window opening under the balcony. Curse you, diffraction!
RESONANCE

Figure 3 Acoustic transmission paths: Ray tracing, diffusion, resonance, and diffraction
Room dimensions can create a sympathetic spacing relationship with a particular set of wavelengths, resulting in resonance. Room and internal cavity resonances can affect the decay characteristic of a room by prolonging certain frequency ranges. A room with repeated spacing relationships between surfaces is likely to be sympathetic to wavelengths sized to fit between them. This can result in a room having a particular range that hangs on long after the others have decayed away. “Helmholtz resonators” are external room-coupled chambers that provide effective absorption of low-and mid-range frequencies. This acoustic effect can be easily demonstrated by blowing air over the opening of a beer bottle. The resonant frequency corresponds to the size of the sound waves that fit in the chamber. A sound engineer will be happy to demonstrate how the resonance frequency falls along with sobriety as the bottle is emptied.
DRIVERS AND HORNS
The size of a cone driver correlates to the size of the wavelengths it can efficiently reproduce and the direction pattern created. A front-loaded driver is flush-mounted to the enclosure with a flat front surface. The enclosure provides no directional steering beyond the flat baffle reflection. Internal volume and reflex port tuning affect the LF range lower limit (larger cabinet size corresponds to the ability to extend to larger wavelengths. The beamwidth of a front-loaded cone driver is predictable and varies with driver diameter. It’s widest in the LF range and narrows with frequency, a phenomenon termed “proportional directivity.” The pattern will be 90° when speaker diaphragm and transmitted wavelength are equal size. At lower (larger) frequencies the coverage will be wider than 90 degrees and vice versa. The upper limits of a speaker’s range are also size-related. Wavelengths significantly smaller than the driver size will scatter into sidelobes, which will render them inapplicable for our sound system application (though not for guitar amps).
Size also plays a critical role in the performance of horns. Well-engineered horns are sound reflectors that guide the sound to create a wavefront with a directional pattern stamped on it that will continue after it has left the mouth. The horn flare (in both planes) is the driving force in creation of the directional control. This is scalable. In other words, a big horn and a small horn made from the same equation will have the same pattern. The size of sound however does not scale—1kHz has fixed size (neglecting temperature, atmospheric pressure changes, etc.) and therefore it fits very differently into a small horn than a big one.

Figure 4: Comb filter reference
This is a Goldilocks aspect for any real physical horn: it is too big, too small, and just right, depending on the wavelength. Too big means there are reflection paths that create cancellations, thereby reducing efficiency and disturbing the efforts to consistently guide the sound into a given shape. Too small means the guidance tool (the horn flare) is too small to effectively steer the wavelengths and does not “couple” with the direct sound, resulting in reduced efficiency. Just right means we realize the efficiency gains and have consistent steering without cancellation lobes. Therefore any given horn has a limited working range that must be respected.
The cutoff frequency is the lowest range where the horn increases efficiency and maintains directivity. The driving forces are a combination of horn length, mouth size, and flare rate. It is generally agreed that the horn length should be a minimum of ½ l and the mouth circumference should be at least 1l. If you want big deep low end, get a big deep horn.
Let’s see how size matters when we put cones and horns together. A standard two-way configuration commonly uses a front-loaded LF cone and HF compression driver or dome tweeter. The two-way family generally scales the two drivers together; i.e. smaller LF drivers pair with smaller HF drivers. LF drivers usually range from 5in. to 15in. while the accompanying HF drivers would be around 0.75in. to 4in., respectively. Crossover frequency falls as the size scales up, generally ranging between 4kHz and 800Hz over the scaling. LF operating range also falls as the size scales up, generally ranging from 100Hz to 40Hz.
There are innumerable variations by make and model. The driver loading (horn-or frontloaded) will affect the scale ratios between components and crossover frequency. The front-loaded woofer and medium-size horn are the standard pairing, e.g. a 12in. and 3in. driver set with a 1200Hz crossover. We can expect a larger HF driver and lower crossover if the LF driver is horn-loaded. As HF horn size rises, the cutoff frequency falls, allowing for a lower crossover (and a larger HF driver). If the HF driver has a small horn or a dome tweeter, the LF driver will be scaled down and crossover rises. These are basic trends and there are exceptions (both good and bad). My all-time favorite two-way configuration was the old Cerwin-Vega box with an 18in. and a piezo-electric tweeter, passive. Not!
SPACING

Figure 5 Spectral and spatial summation are linked by wavelength offset
The spacing between multiple speakers and surfaces is size-linked to the acoustic behavior. At stake here is whether the speakers will couple (to themselves and/or the surfaces) or uncouple and potentially scatter the sound. Let’s start with speaker-to-speaker. Coupling is best maintained by minimizing the spacing, which keeps phase offset (the enemy of coupling) to a minimum. Spacings of 1/2 l or less will fairly guarantee highly efficient coupling because the area forward of the speakers is essentially “in phase” and the side areas less so. When the spacing reaches 1l or more, we can fairly guarantee poor coupling because the side areas are also essentially “in phase” (although a cycle or more behind), which creates side lobes.
Every speaker-to-speaker spacing has these milestones. The size-related question is at what frequency we migrate to the dark side (lobe). The counterforce to side lobe generation is directional control. If we can keep our speakers close enough to reach the range where the elements don’t have a lot of energy on the sides, then we are safe to uncouple the array. A typical main array stays close enough to maintain coupling in the lows where the individual elements lack directivity. As frequency rises the elements are engineered to increase their directional control and minimize the sidelobes associated with the small sound size relative to the spacing.
The relationship of speakers to surfaces is much the same. We instinctively know the benefits of placing subwoofers on the floor because this spacing provides ideal coupling at those wavelengths. We quickly learn why we avoid placing high horns right next to surfaces (when we can) because even a small spacing is too large for our tiny HF wavelengths.
Comb filtering is another spacing-related effect. Sources that arrive at different times (multiple speakers or reflections) will modify the frequency response with a series of peaks and dips; i.e. comb filtering. The response is completely predictable if we are fluent in the size of sound. Two sources that are 1l apart will show an octave-wide peak at that frequency, and narrower peaks and dips above. When sources arrive 2l apart, the peak will be 1/2 octave, 3l create a 1/3 octave peak, and so on. If the travel distance between two speakers is the length of your elbow to your fist, then we can expect to see a peak a 1kHz will appear along the line of separation (Figs. 4 and 5).
CONCLUSION
We can’t see the size of sound directly, but there is great benefit to being able to visualize it in our minds. Modern audio analyzers are very helpful in this regard since they show us phase, from which we can find the wavelength. These modern analyzers are the best learning tool to help us to acquire the ability to see sound in the room.


